To help you track and understand your energy usage, the Valda Energy Customer Portal provides easy to read charts and data views.
Where can I find my usage chart?
You can access your usage charts by:
This section shows how much energy each of your meters has used over different time periods.
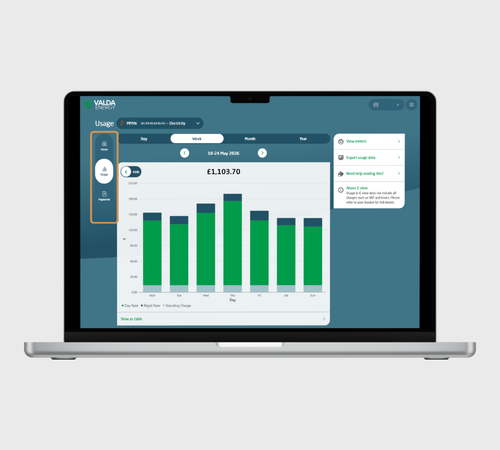
Understanding your usage chart
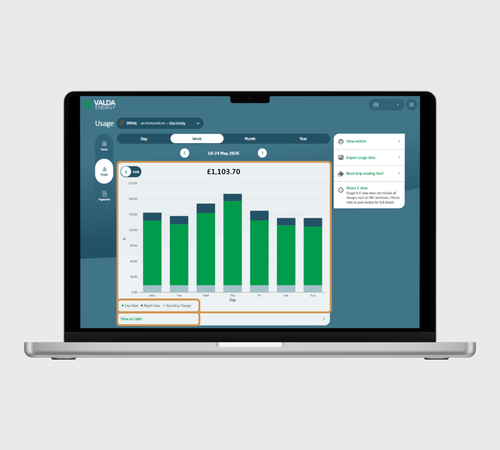
Your usage is displayed as a stacked bar chart, showing a breakdown based on your tariff. For example:
You can switch between viewing your usage in kWh or pounds using the toggle.
Important: The pounds view is an estimate and does not include additional charges such as VAT or levies. For your actual costs, always refer to your invoice.
You can also select ‘View as table’ beneath the chart to see your data in a tabular format.
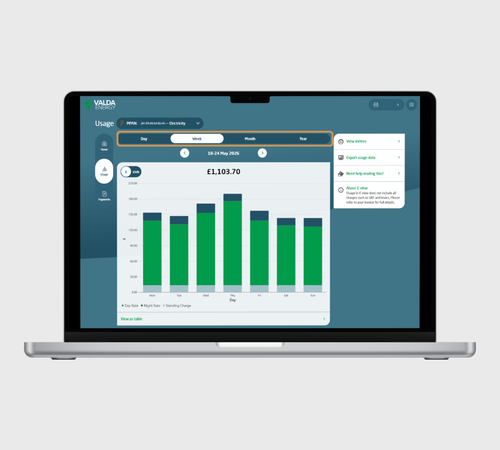
Changing how you view your usage
Depending on your meter type, different time views are available:
With a smart meter:
Without a smart meter:
There will be no usage displayed. To gain access to usage data, you will need to book a smart meter installation.
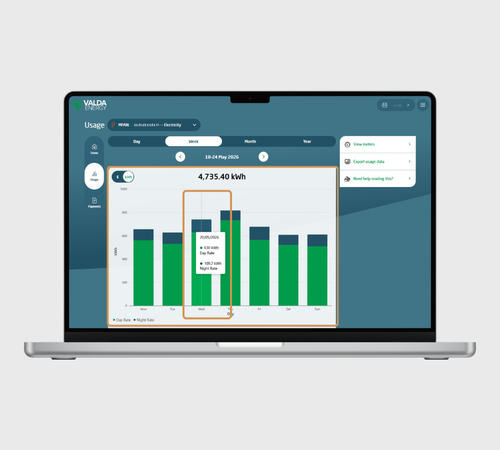
Viewing detailed data
Click on any bar in the chart to see a detailed breakdown of your usage for that period. This works in both kWh and pounds view.
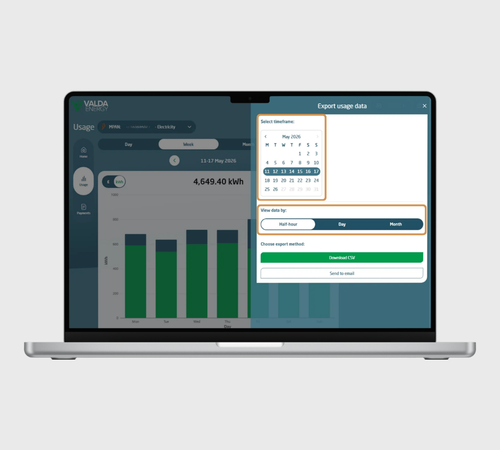
Exporting your usage data
To download your usage data:
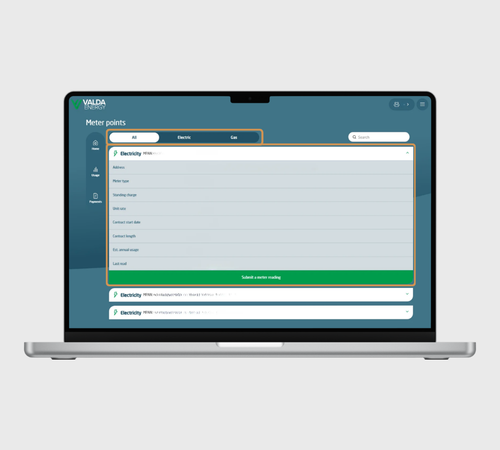
Viewing different meters
If you have more than one meter:
This will also show the meter number and whether it is gas or electricity.

Call us on:
0330 390 4510

LiveChat now